How to Learn Your Mac’s Specs and Check Its Condition (Desktops and Laptops)
Read this article to find out how to get all necessary information about your Mac – its technical specifications, system condition – and how to monitor its processes and view the event log.

- Method 1. Main specifications of your Mac
- Method 2. Additional information about your Mac system
- Method 3. The top command
- Method 4. The iostat command
- Method 5. iStat Menus
- Method 6. Viewing system logs
- Conclusion
- Questions and answers
- Comments
Just like any other computer, your Mac may need a bit of your attention from time to time. We’ll consider a few methods that help you to find all information required to make sure your device works as efficiently as it should.
We’ll explore how to find your mac’s specifications, how to monitor its performance, and how to quickly identify any system issues.
| Method | Name | Description |
|---|---|---|
| 1 | Basic Mac Device Specifications | Open the Apple menu and select “About This Mac.” Here you can view basic specifications such as the model, processor, memory, graphics, and the device’s serial number. |
| 2 | Additional System Information | In the “About This Mac” window, click the “System Report” button. This will provide you with detailed information on hardware, network settings, and other system components. |
| 3 | top Command | Use the “top” command in Terminal to view information about active processes, CPU, and memory usage in real-time. |
| 4 | iostat Command | The “iostat” command in Terminal allows you to monitor system performance, including disk input/output, which is useful for diagnosing disk drive performance. |
| 5 | iStat Menus | Install the “iStat Menus” app, which allows you to monitor the system’s health in detail, including temperature, CPU, RAM, disk usage, network, and other critical parameters. |
| 6 | View System Logs | Open “Console” to view system logs that contain detailed information about the status of various components and potential errors. |

Understanding Your Mac's Specs and Health Status
Method 1. Main specifications of your Mac
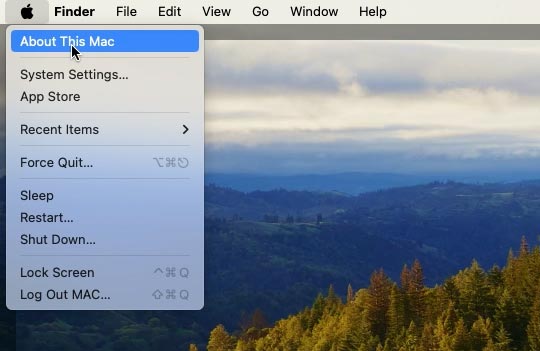
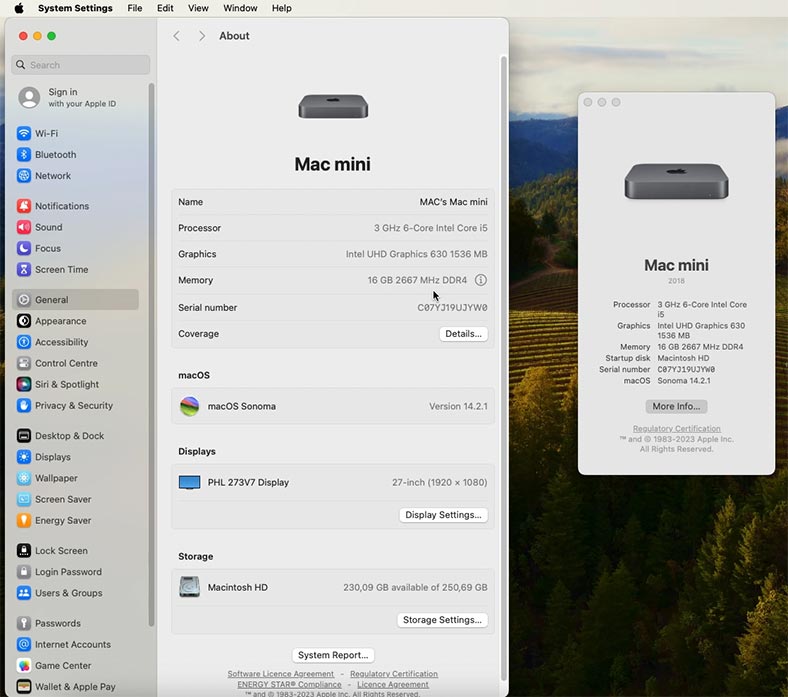
For starters, let’s see how to find the main specifications of your Mac. Do it by clicking on the apple icon in the top left corner of the screen. From the drop-down list, choose About This Mac.
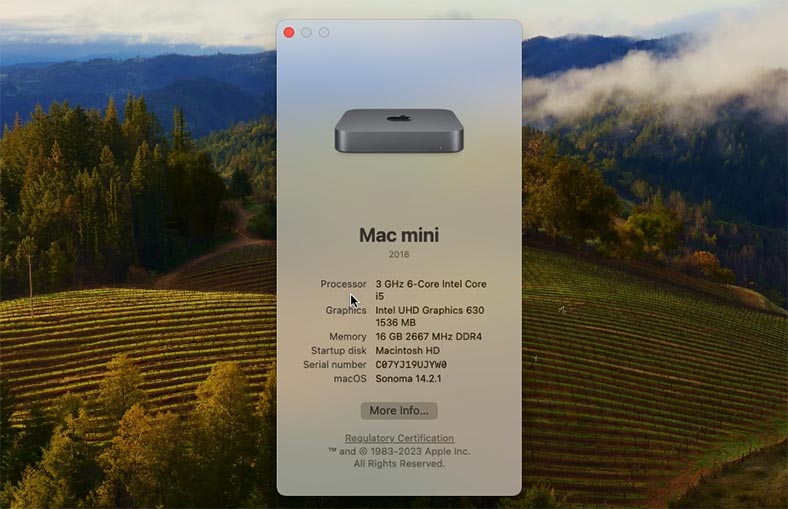
In the window that opens, you can see general information about this device, such as its model, processor, graphics, memory, serial number and the version of the operating system.
To find more detailed information including graphics data, click on More Info. You will see the following information: processor, graphics, memory and storage.
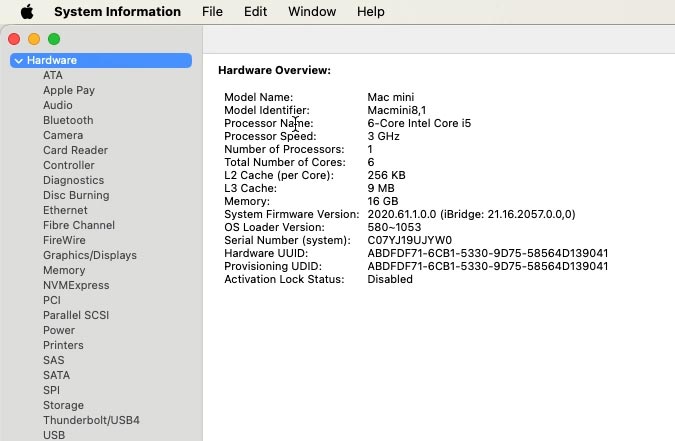
To get all the information about the network, hardware and software, open System Report. This report gives you detailed information about every aspect of your Mac’s hardware. It gives a detailed overview of the central processor – number of cores, frequency, cache. The amount of installed system memory, the system firmware version and so on.
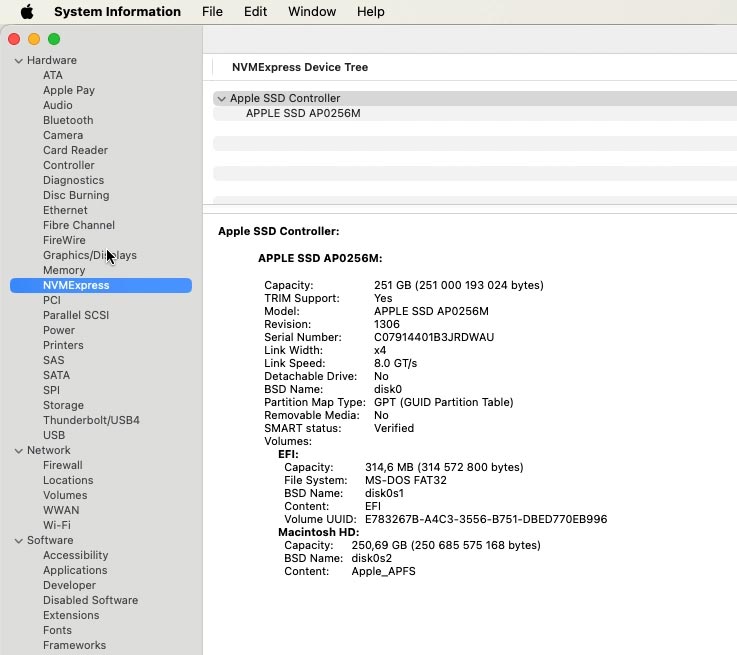
As you go down the list, you can open details specifications for every piece of hardware installed on this device. Bluetooth module, network adapter, NVME storage, graphics processor and display, sound devices and Mac speakers, system memory, storage, and connected USB devices.
In the Diagnostics tab, you can find information about errors and failures that your computer might have had.

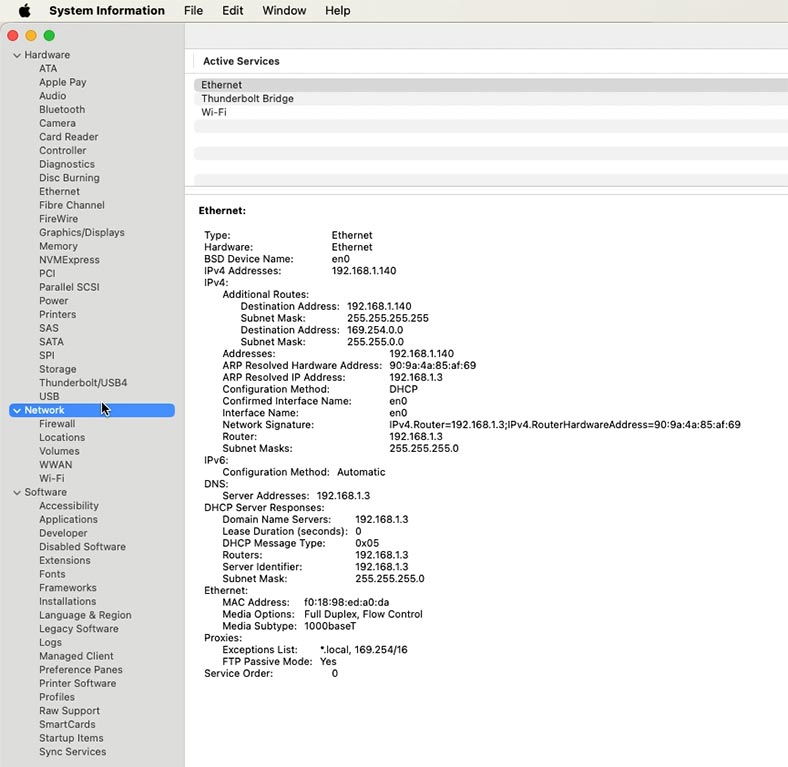
If you need to learn the IP address and MAC address of your device, there is a Network tab below that provides you with detailed information about your connections. You can see all the details by clicking on each line of this list.
In the Software tab, you can find everything about the installed programs and extensions, view the file system repair log, the installer log, and other logs on this list.
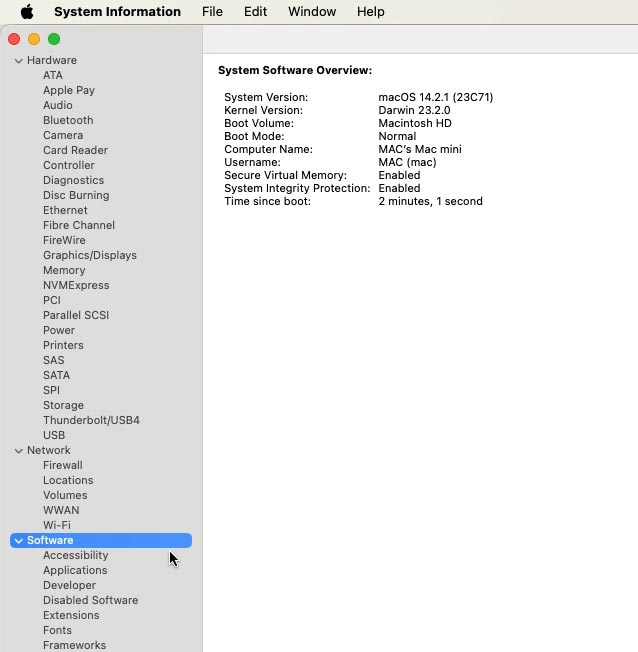
System Report provides you with exhaustive information that can be used to analyze and solve various issues, or to upgrade and improve hardware elements of your Mac.
All right, now that you know where to find detailed information about specifications of your device, let’s see where to look for additional system data.
Method 2. Additional information about your Mac system
Activity Monitor is an integrated macOS tool that offers detailed information about the system operation, current processes, resource usage and other important things. You can find it by opening Launchpad: Applications – Other – Activity Monitor.
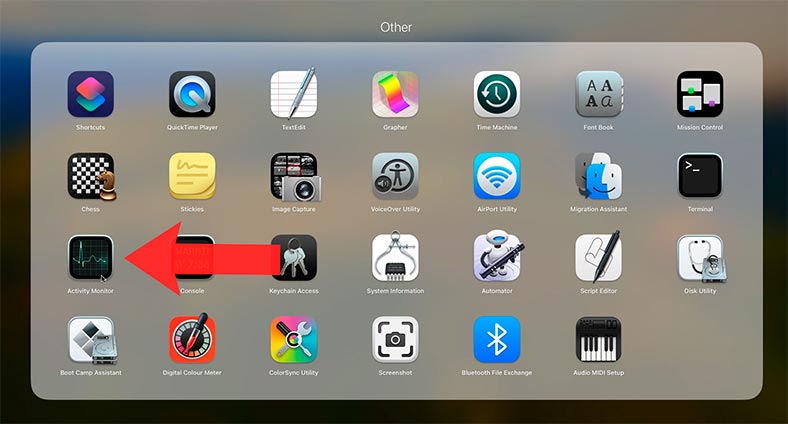
Here are some of the main functions and features offered by Activity Monitor:
-
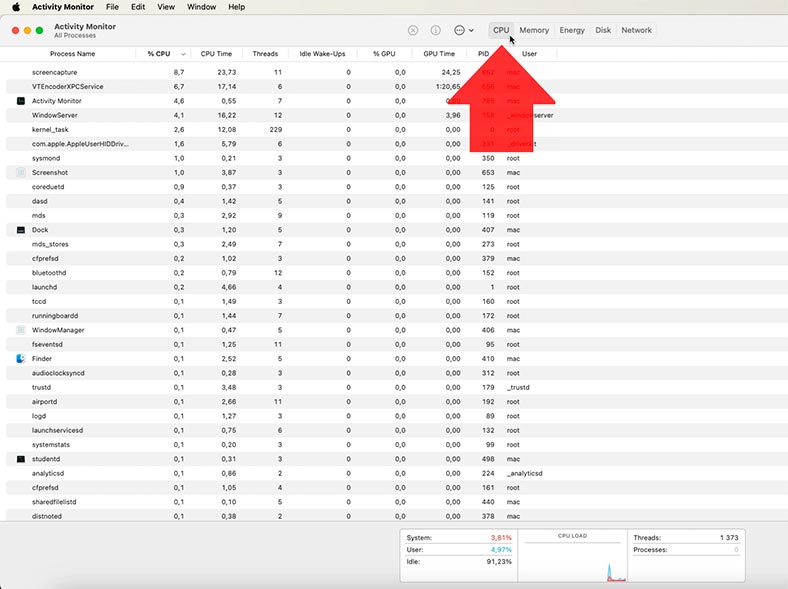
The CPU tab shows processor usage by the whole system, and by every single process. You can see the percentage of CPU load, the number of active threads and processes, as well as the information on the processes that consume the major share of all resources.
-
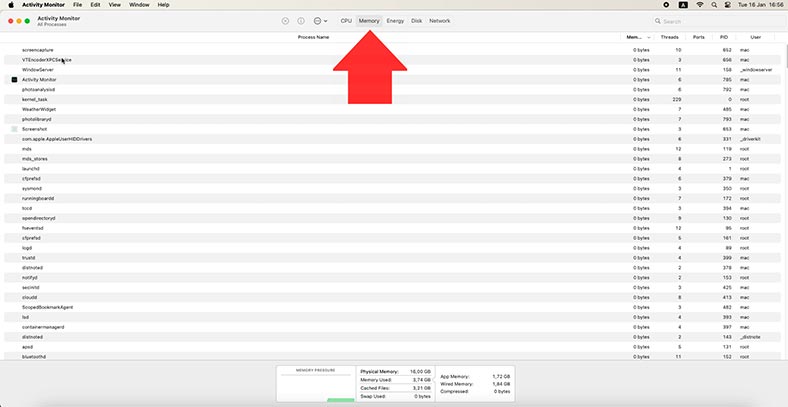
The Memory tab displays how system memory is used by the operating system and every process which is running.
-
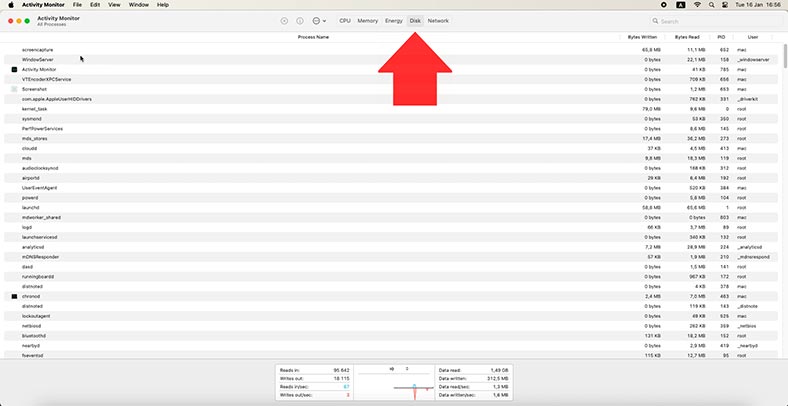
The Disk tab displays disk system activity, including data reading and writing. You can also see the information about every active process that is using the disk system.
-
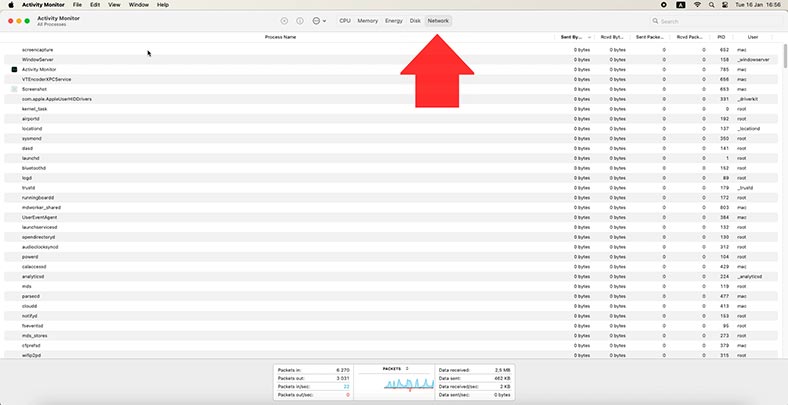
The Network tab displays network activity, including sent and received data. You can see the amount of sent and received bytes, as well as the information on every active process using the network connection.
-
The Energy tab shows you energy consumption – overall system consumption, and consumption by process.

Activity Monitor also lets you view and end processes, as well as save reports about the system’s operation for further analysis. This tool is a powerful means of monitoring and fine-tuning your Mac.
Method 3. The top command
Also, you can view some specifications and system status with the help of the Terminal. For example, you can use the command top to view the system load status.
top is a command utility in UNIX-type operating systems that provides a real-time, dynamic view of the system load and process activity. It displays exhaustive information about current system performance and running processes.
To start it, open the Terminal. You can find it by opening Applications – Terminal. Run the command:
top

As a result, you will see a huge chart that looks similar to the Activity Monitor. It displays CPU load for every single task.
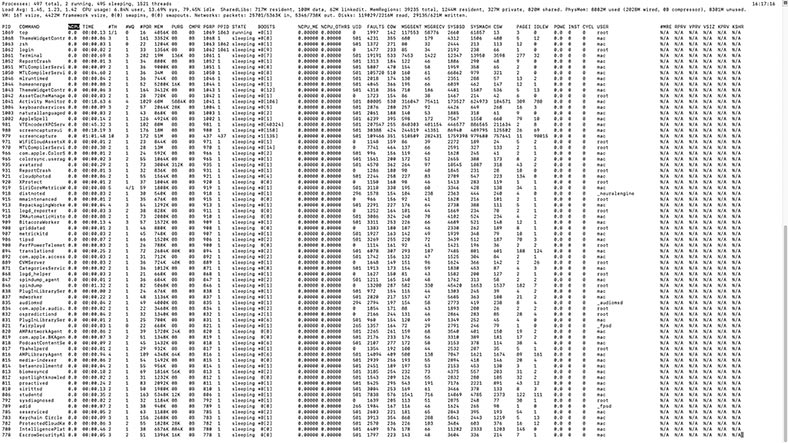
Type “q” to exit.
Method 4. The iostat command
One more useful command is iostat.
iostat is the command to display the system input / output (I/O) statistics, including the data on disk activity. This command is especially useful to monitor disk performance.
To start it, run the following command in the Terminal:
Iostat
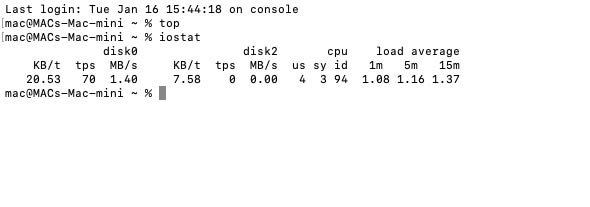
Run the command without parameters to view the default statistics.
Both commands - top and iostat - provide valuable data to monitor system performance and identify possible bottlenecks.
Method 5. iStat Menus
Also, there are third-party tools to help you monitor your system condition. For example, you can do it with the help of a special utility, istat Menus. To enjoy a more in-depth system monitoring, install iStat Menus from Appstore.
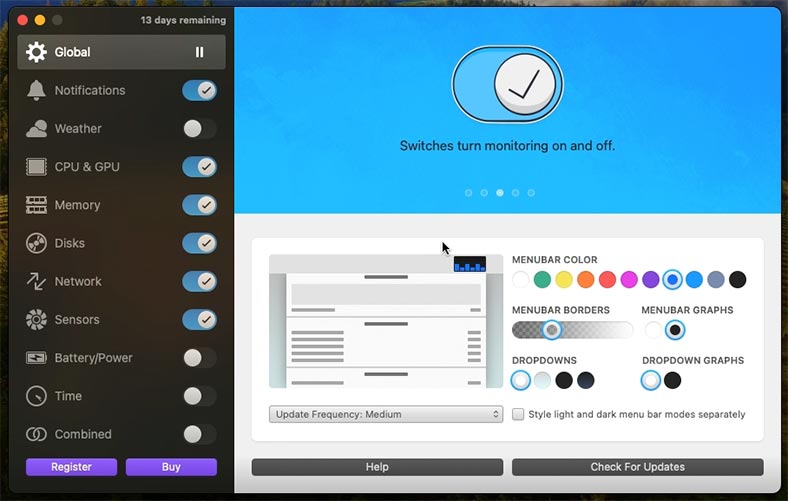
iStat Menus is a commercial tool designed to monitor your macOS system and provide detailed information about your Mac’s condition, including CPU, memory, network and disk usage as well as temperature sensor data. Here are some of the main functions and features offered by iStat Menus:
-
Menubar: iStat Menus add additional items to your Mac’s menubar, where you can see current system information and quickly access various tool features.

-
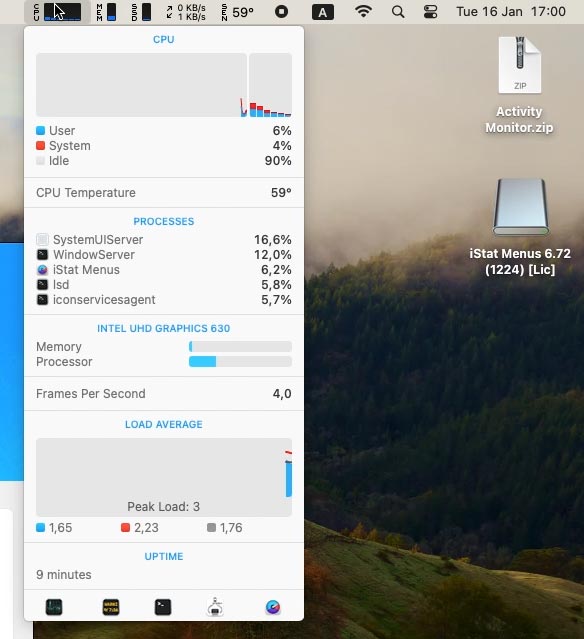
CPU & GPU: iStat Menus displays processor load as percentage, and provides information about every active process. You can see which processes consume most resources and can cause the CPU to be overloaded.
-
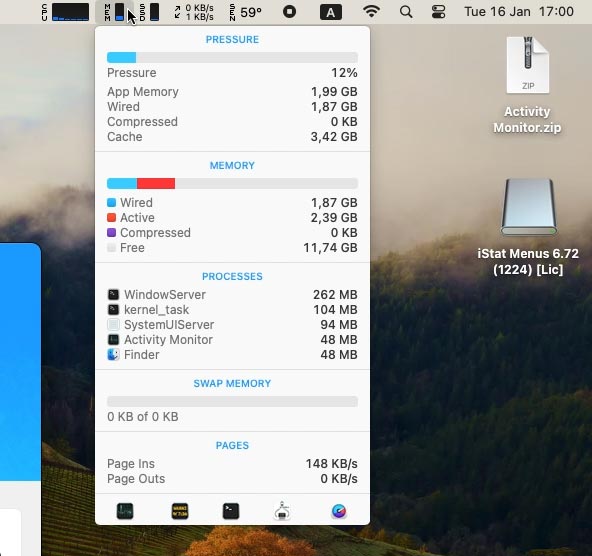
Memory: The application displays how system memory is used by the operating system and every process which is running. You can see the total amount of available memory, memory usage by applications and by the operating system.
-
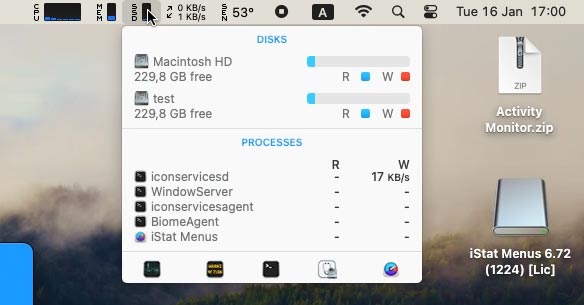
Disks: iStat Menus displays disk system activity, including data reading and writing. You can see the amount of sent and received bytes, as well as the information on every active process using the disk system.
-
Network: This application displays network activity, including sent and received data. You can see the amount of sent and received bytes, as well as the information on every active process using the network connection.
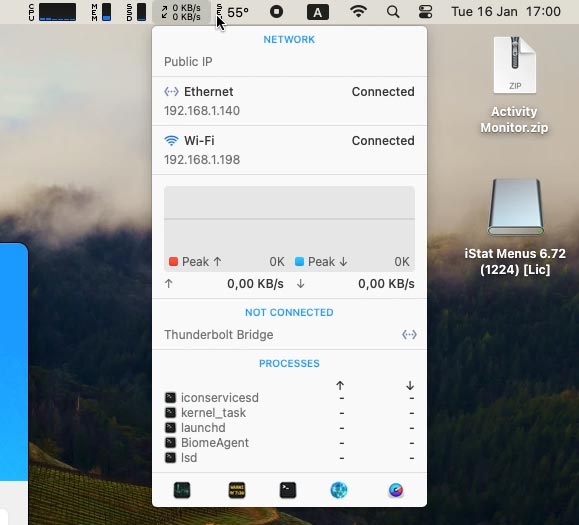
-
Sensors: iStat Menus lets you monitor the temperature readings for the central processor, graphics processor, and other components of your Mac. You can also view information about fan speed and data from other sensors.
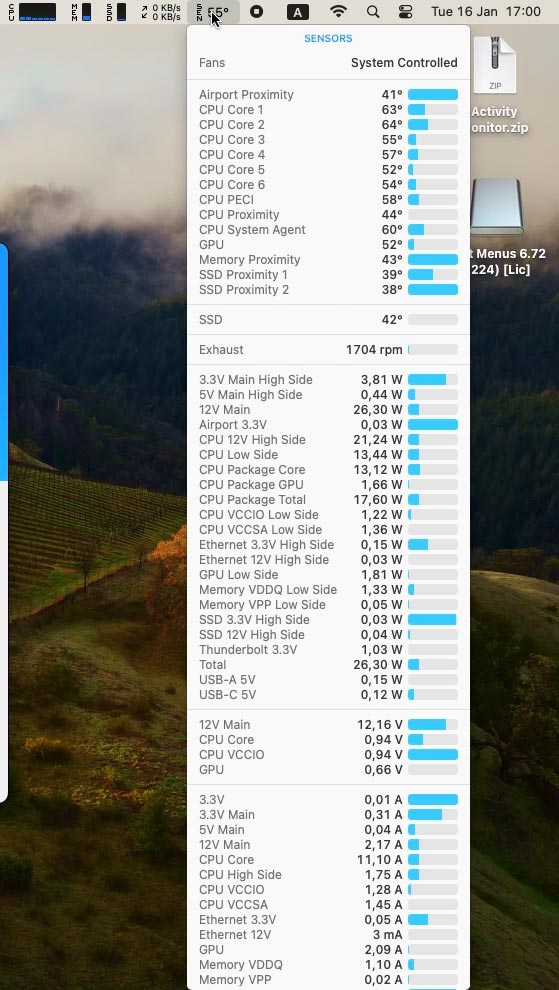
-
Notifications and graphs: This app enables you to configure notifications to be displayed when certain values are exceeded - for example, in case of high CPU load or excessive temperature. It also lets you display information as graphs to visualize various changes over time.
iStat Menus offers a multitude of settings and options to configure the information to be displayed and the application’s appearance. It’s a powerful tool for monitoring your Mac and can be useful for both ordinary users and technical specialists.
Method 6. Viewing system logs
One more way to monitor your system status is viewing the system log.
System logs in your Mac contain information about various events, errors, warnings and other data connected to the work of its operating system. They can be used to diagnose issues, track various activities, and to get a general idea what’s going on inside your computer.
In macOS, you can view system logs with the Console utility. It’s an app with a graphical interface that lets you access to various logs.
To start this utility, open Spotlight Search (by pressing Cmnd + Space) and type Console, then run the utility.
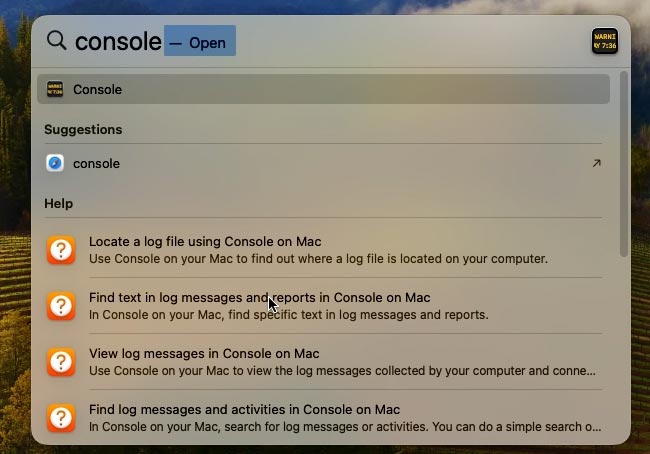
In the left panel, click on Log Reports. It contains the following logs:
- System log (system.log) which contains information on system events such as system startup and shutdown, software updates, kernel errors and other system notifications.
- Installation log (install.log) which contains information about software installations performed on your Mac, including successful and failed installations, errors and other related data.
- Kernel log (kernel.log) which contains information about the work of the operating system kernel, including device drivers, detected and connected hardware, as well as kernel-related error and warning messages.
- Application log (app.log) which contains information about the work of applications on your Mac, including errors and warnings, as well as other debugging information provided by software developers.
- Network log (network.log) contains information about network activity on your Mac, including network connection, sent and received data, and other network-related information.
- Bluetooth log (bluetooth.log) contains information about the work of Bluetooth on your Mac, including connection and disconnection of other devices, data transmission, errors and other related information.
- Time Machine log (backup.log) contains information about backup operations performed with the use of Time Machine, including successful and failed backups, errors and other related data about backup processes.
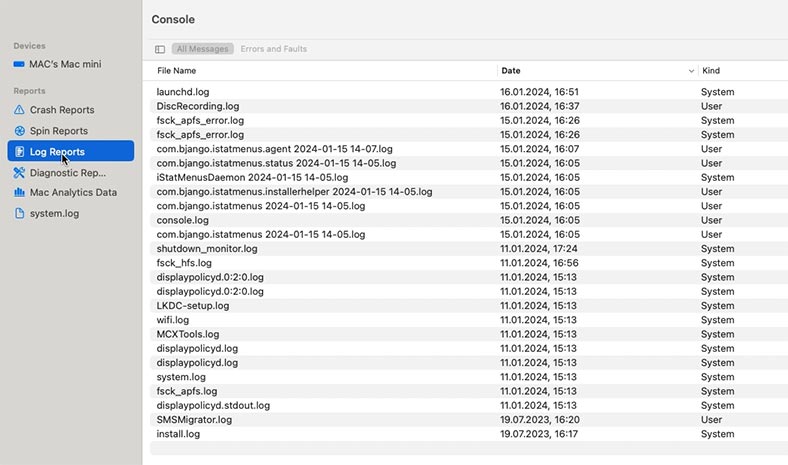
System logs in macOS can be useful when you want to analyze a problem, search for errors, monitor your computer’s activities and understand how the operating system works. They can be especially handy for developers and technical specialists, but also helpful for ordinary users when they look for a solution to a certain issue.
Also, you can use the Log show command in the Terminal to view logs.

This command will display the log event, beginning with the current date. It provides a pretty detailed and convenient way to study system logs in macOS. Here you can view all notifications related to system errors.

Conclusion
Well, now you know how to find as much information as possible about your Mac. Integrated macOS tools provide basic information, help you learn your device specifications and monitor various system aspects, from CPU and memory status to storage and network conditions.
Third-party software like iStat Menus can extend the monitoring functionality by adding extra information panels to your desktop. They will help you to track temperature values, monitor the use of system resources, and receive notifications of any problems or issues.
Regular system monitoring allows you to identify potential problems early enough and take action to maintain optimal performance of your Mac. Keep track of your system status to avoid nasty surprises and make sure your computer will work reliably for a long time.

🍏 Recovering Data after Mac OS Update, Reinstall or Disk Format 🍏


