Google Chrome Task Manager: Purpose and Usage Guide
Ever wondered why the “Google Chrome” Task Manager exists and how to make the most of it? You’re in luck! In this article, we’ll provide you with an essential guide to the “Google Chrome” Task Manager, explaining why it’s there and how to use it effectively. From managing tabs and extensions to troubleshooting performance issues, we’ll walk you through the features and functionalities of the Task Manager. Whether you’re a casual user or a power user, understanding the “Google Chrome” Task Manager can enhance your browsing experience and optimize your system’s performance. Watch now and unlock the secrets of the Task Manager!

- Step 1. Open Google Chrome Task Manager
- Step 2. End any troublesome processes
- Step 3. View data on the resources used by the running tasks
- Conclusion
- Questions and answers
- Comments
Similarly to most operating systems that feature integrated applications like Task Manager or Resource Monitor capable of monitoring all active processes and programs running on a user’s computer, a popular web browser Google Chrome also has such function which helps users to get rid of problem-plagued tabs and extensions. Below, we will explore this topic in detail.
| Parameter | Description |
|---|---|
| Name | Google Chrome Task Manager |
| Purpose | Manage open tabs, extensions, and browser processes with the ability to end them. |
| Access | Browser menu → “More tools” → “Task Manager” or the shortcut Shift + Esc. |
| Functionality | – Display resource usage (CPU, memory, network)
– End individual processes – Monitor extension activity |
| Metrics | – CPU usage
– Memory consumption – Network traffic activity – Execution time |
| Advantages | – Helps identify tabs and extensions consuming a lot of resources
– Allows quick termination of frozen processes |
| Limitations | Does not display processes outside the browser or their exact impact on the operating system. |

Task Manager in Windows 10, 8 and 7 (Functions, Starting and Restoring) 💻📊🛠️
Step 1. Open Google Chrome Task Manager
Just as any other function in Google Chrome, this feature can be accessed from its control panel. Here’s the sequence of steps to follow to start using it.
Step 1. Start Google Chrome on your computing device.
Step 2. In the upper right corner of the browser window, next to the address bar and buttons for controlling browser extensions, you can see the Customize and control Google Chrome button shaped as three vertical dots – click it to open the main menu.
Step 3. In the menu that appears, find the section More tools, hover on it to bring up the nested menu and select Task manager.
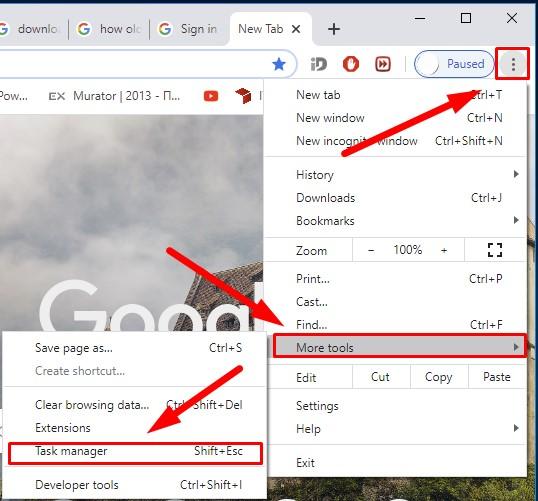
Note: For advanced users, Google Chrome saves the opportunity to open the Task manager window directly and without having to deal with the menu buttons. Access it by pressing the key shortcut Shift + Esc if you are doing it from Windows, or by pressing the key shortcut Search + Esc if you are using Chrome operating system.
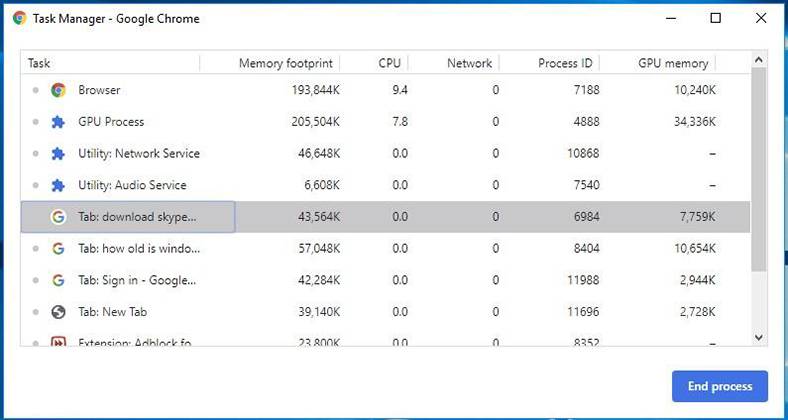
Now that the Task manager window is opened in Google Chrome, you can view the chart that presents the list of all tabs, extensions and processes running at the moment.
Step 2. End any troublesome processes
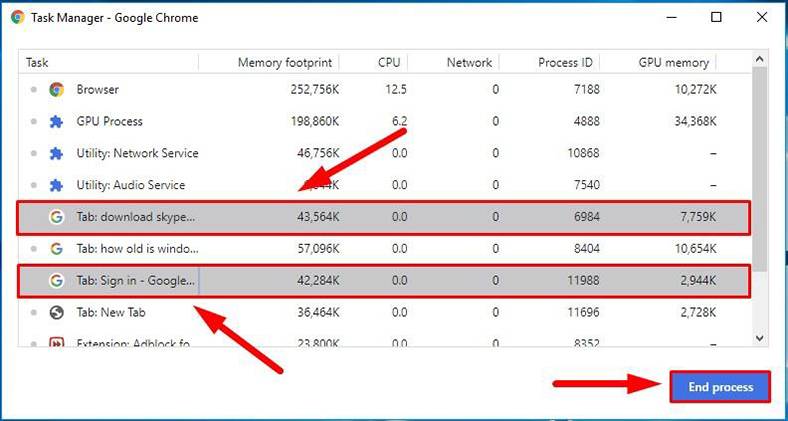
With a quick look at the running processes displayed in Task manager, you can end any of them using the functionality provided by this tool. This opportunity could be especially useful when a certain tab or service isn’t responding, freezes or fails.
To force a process to end, find it in Google Chrome Task Manager, select it by left-clicking on it, and then click End process, so that the browser will stop it.
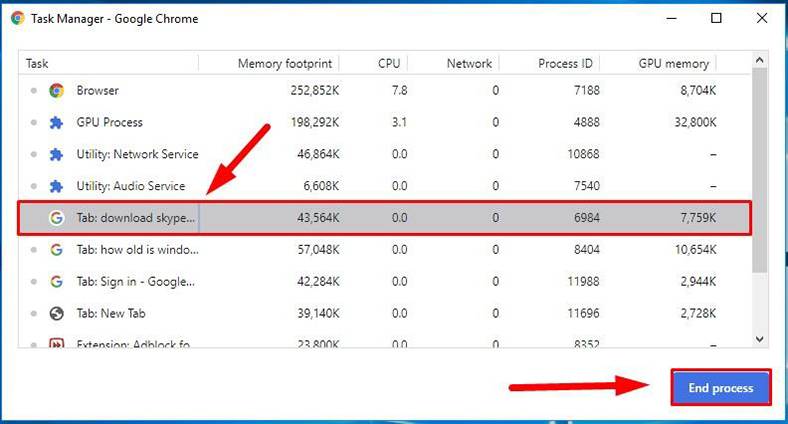
When you need to select several processes which you don’t need to run anymore, or if some active processes encounter errors or fail, you can end such processes simultaneously by checking the required elements on the list, while holding down the Shift or Ctrl button (or the Command button on Mac devices) to extend the list of selected items, and then clicking the End process button to complete the action.
Step 3. View data on the resources used by the running tasks
The default view for Task manager contains a set of resources based on data from several important data sources. However, the full functionality of Google Chrome is not restricted to that list of resources, and there’s a way to see all resources consumed by each of the active tasks. At your choice, Google Chrome can provide access to over twenty categories of statistical data that can be added to the Task manager as extra columns.
To change the amount of data shown for a certain task, right-click on the task that you want to know more about and open the context menu containing the comprehensive list of all statistical data about such process.
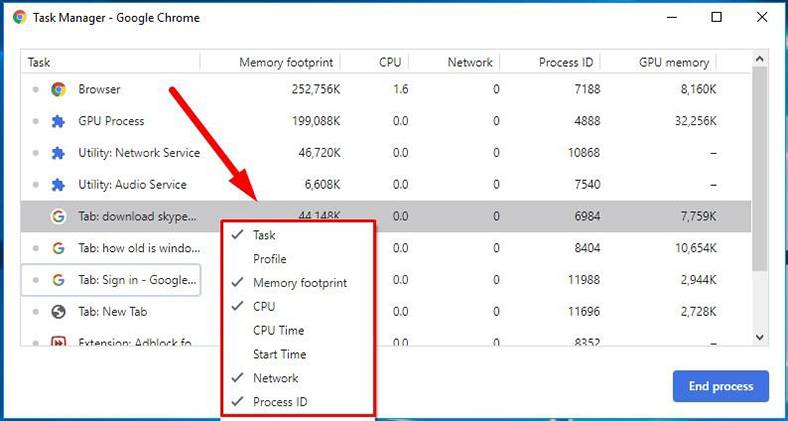
While the list is opened, left-click on any extra category to add it to the Task manager default window. The categories with a tick next to them are the ones already included into the default view. And vice versa, if you want to remove a certain column of statistical data to make the manager window less informative, open the context menu again and click on the category you want to hide so the tick disappears. As a result, this column will not be shown in the main window of Task manager.
Here’s the full list of all categories that can be displayed if you enable them:
- Task
- Profile
- Memory footprint
- CPU
- CPU time
- Start time
- Network
- Process ID
- GDI handles
- User handles
- Image cache
- Script cache
- CSS cache
- GPU memory
- SQLite memory
- NaCl debug port
- JavaScript memory
- Idle wake ups
- Hard faults
- Process priority
- Keepalive count.
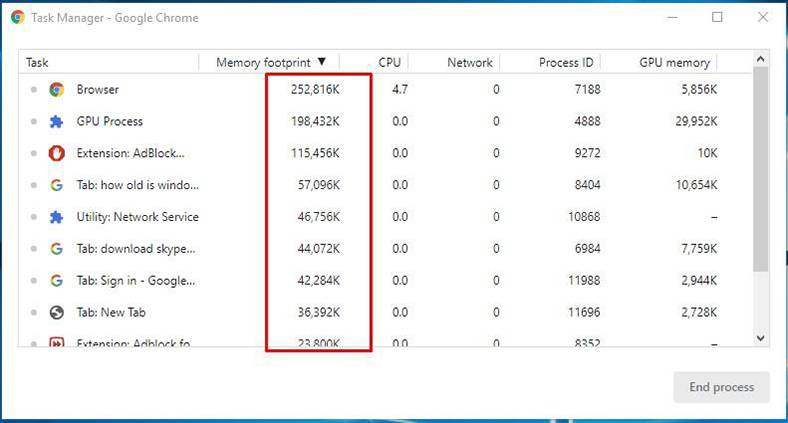
You can sort data in a particular column by left-clicking on the column name. For example, if you click on the column Memory footprint, the process using the largest amount of memory will be listed first and other results will be listed in a descending order.
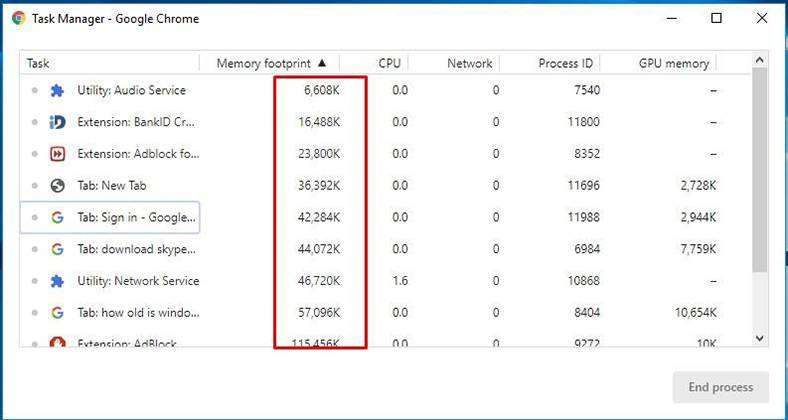
If you click on the column Memory footprint again, the list will be reverted to an ascending order and put the process talking up the least amount of memory to the first position.
A hint for experts: double-clicking on the line of an active tab in the Task manager window will make Google Chrome open this tab instantly. If the user selects a certain extension, the browser will open a new tab to display the settings for this extension.
Conclusion
In Google Chrome, one of the most popular web browsers in the world, you have vast opportunities to improve its functionality by installing various extensions. Google Chrome features a special tool, Task manager, which is in charge of monitoring activities and collecting statistical data on all active tabs, running extensions and processes, just like it is done by similar-named services in computer operating systems.
If any unexpected situations related to freezing tabs, application or processes occur, or when you just wonder how much resources are required by a certain process inside Google Chrome, you can use the statistics displayed in Task manager. It is easily accessible and capable of presenting enough data on all processes running inside the browser, with an extremely useful option of eliminating the problem by forcing any process to end.

📝 How to Add or Remove a Program from Startup 🔄 in Windows 10, 8 or 7


