Anticipate SSD Failures with Key S.M.A.R.T. Metrics
Unlock the power of predictive maintenance for your SSD! In this article, we delve into the world of S.M.A.R.T. values and how they can help predict SSD failures before they occur. Discover the specific indicators to look out for and learn how to interpret them effectively.

- Chapter 1. Critical SMART parameters for SSD drives
- Chapter 2. CrystalDiskInfo
- Conclusion
- Questions and answers
- Comments
Chapter 1. Critical SMART parameters for SSD drives
| ID | Attribute name | Description |
|---|---|---|
| 05 | Reallocated Sectors Count | Count of reallocated sectors. The raw value represents a count of the bad sectors that have been found and remapped. |
| C5 | Current Pending Sector Count | Count of “unstable” sectors (waiting to be remapped, because of unrecoverable read errors). If an unstable sector is subsequently read successfully, the sector is remapped and this value is decreased. |
| C6 | Uncorrectable Sector Count | The total count of uncorrectable errors when reading/writing a sector. A rise in the value of this attribute indicates defects of the disk surface and/or problems in the mechanical subsystem. |
| C7 | UltraDMA CRC Error Count | The count of errors in data transfer via the interface cable as determined by ICRC (Interface Cyclic Redundancy Check). |
| А9 | Life Remaining | Percentage of remaining SSD life. Indicates memory wear, which is critical for predicting disk replacement time. |
| B1 | Wear Leveling Count | Counts the maximum worst erase count on any block. |
| E8 | End-to-End Error/Total NAND Writes | Raw value reports the number of writes to NAND in 1 GB increments. |
| E9 | Total LBAs Written | Total count of LBAs written. Some SSD (for example, manufacture by Western Digital and Seagate) use 1 GiB as unit of this attribute. |
Chapter 2. CrystalDiskInfo

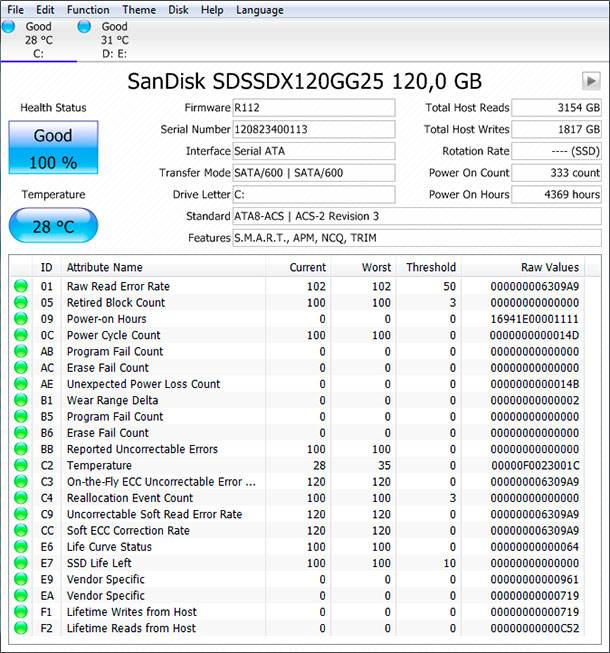
Wear Leveling Count. This variable is vendor-specific. It decreases with time. When it reaches a certain manufacturer-defined threshold, S.M.A.R.T. reports the drive’s overall health as FAILED.
Erase Fail Count. The number of failed attempts to erase the content of a flash chip. Increase in this number may mean that flash chips are dying prematurely (before reaching their rated number of erase/write cycles).
SSD Life Left. Supported by few manufacturers, this parameter represents calculated lifespan remaining in the disk based on certain equations. When normalized, it reads 100 (100%) for healthy drives to 1 (1%) for dead SSD’s. Sometimes replaced with Percentage of the Rated Lifetime Used.
Percentage of the Rated Lifetime Used. This is the opposite of SSD Time Left. 1 means the drive is 100% healthy, while 100 means that 100% of the drive’s lifetime is used up, and the drive can be used as a small doorstop.
Grown Failing Block Count. Manufacturer-specific value representing the number of reallocation events. A rise in this value represents a problem with the drive.

SSD Diagnostics: Programs to Find and Fix SSD Errors 🛠️🔎👨💻
Conclusion
Generally speaking, lifespan of SSD drives should be easier to predict compared to traditional HDDs as there are no mechanical elements prone to unpredictable wear. With SSD’s, one can simply analyze wear leveling count to figure out how many write cycles are left, or read calculated variables such as SSD Life Left/ Percentage of the Rated Lifetime Used. Unfortunately, it’s not as easy. Early SSD drives were known for abrupt, premature failures with close to zero chance of successful data recovery.
The situation improves with newer models, but sudden, unpredictable failures still happen. SSD drives of all manufacturers (e.g. Sandisk, Transcend, etc.) go out of order unexpectedly: it worked just fine yesterday, but appears to be dead today. Ironically, it may be easier to predict a failure of a mechanical HDD by listening to unusual noises made by the drive or looking at certain other S.M.A.R.T. parameters. Either way, no degree of monitoring and S.M.A.R.T. analysis can replace a good backup policy. Make sure you always have a recent backup, and you may never need a data recovery tool.

Recovering Data from SSD After File Deletion or Disk Formatting ⚕️📁💥


